If you’ve been around Web3 for more than two seconds, you know that, generally speaking, decentralization is good. Not just regular good, in fact, that’s literally what we’re all here for. Well, that, and the Lambo, of course. But what does decentralization mean? And, as a proper data geek, how can you quantify it?
Enter Nakamoto Coefficient: the metric that estimates a blockchain’s decentralization in hard numbers. In this blog, we will explore this coefficient, explain how it’s calculated, what it means, and why it matters. So grab a coffee, make yourself comfortable, and let’s dive in.
What is the Nakamoto Coefficient?
To make sense of the Nakamoto Coefficient, we need to consider how a blockchain network works. The blockchain is just a database, a ledger that all nodes store locally and update in line with the consensus mechanism. This consensus mechanism, along with a variety of other baked-in safeguards, prevents any single node from going rogue and adding malicious transactions to the blockchain. You can’t just go ahead and give yourself all tokens on the network, if you could, nobody would use your blockchain.
But what if it’s not just one node? What if a whole group of nodes decides to play the system? Well, if there’s enough of them, they can do some very nasty things. Censoring transactions they don’t like. Reversing transactions. Spending coins that have already been spent. Almost like God mode in video games, but with real assets on the line — and real people harmed.
In a way, the Nakamoto Coefficient works as an early warning for such threats.
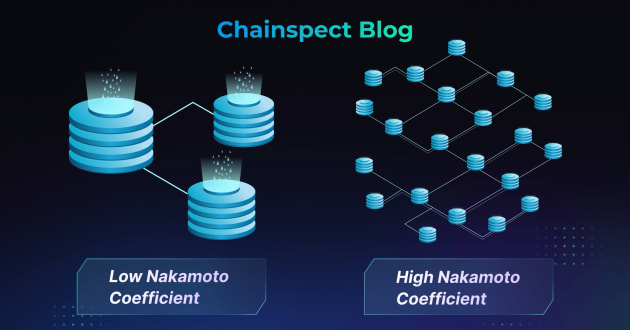
The Nakamoto Coefficient is an estimate of how many independent entities — usually nodes: miners, validators, etc — it would take to shut down or otherwise fundamentally compromise a blockchain. The term was first proposed by Balaji Srinivasan, ex-CTO of Coinbase, and owes its name to the one (or many?) and only Satoshi Nakamoto, Bitcoin’s creator. The higher the number, the harder it is to collude and take over the network.
In other words, by counting the Nakamoto Coefficient for any given chain, you can tell how hard it would be for malicious actors to interfere with it. Sticking to high-NC chains, you can reasonably expect to be safe from such attacks… Or at least safer than on a low-NC one.
So how do you calculate it?
How to calculate the Nakamoto Coefficient?
As an estimate of a chain’s decentralization, the Nakamoto Coefficient must account for how consensus works on a specific blockchain. Here, those who have been around Web3 for a while may think that it works differently for Proof of Work and Proof of Stake chains. And they would be right — so let’s consider these two cases separately.
Nakamoto Coefficient on PoS networks
On a proof-of-stake network, the validators stake the native token as proof of their commitment to honesty and fairness. On most of today’s PoS chains, finalizing a block usually takes the agreement of ⅔ of the validators. Or, in other words, those in control of about 66% of the staked tokens (referring only to PoS staking, not yield farms etc.) just agree on a block for it to join the blockchain.
So what happens if there’s a malicious actor involved? Well, that would depend on how much of the stake they control:
At 66% of the stake, they can hijack the network, rewriting its history, double-spending the token, and causing all sorts of havoc.
At more than 33.33% of the stake, they can effectively shut down the network by abstaining from the block creation process.
Hence, for a PoS network, the Nakamoto Coefficient comes down to how many entities control 33.34% of the stake. Specifics and actual resilience may depend on the exact consensus implementation, but that’s the general rule.
The easiest way to calculate it is to make a spreadsheet with all validators ranked by their total stake share, from highest to lowest. Then, keep cumulatively summing up their shares until you have at least 33.34%. The number of validators you get is the chain’s Nakamoto Coefficient.
As an example, let’s imagine we have a PoS chain with five validators, who hold these respective shares of the total staked tokens:
| Validator # | Share |
|---|---|
| Validator 1 | 30% |
| Validator 2 | 25% |
| Validator 3 | 20% |
| Validator 4 | 15% |
| Validator 5 | 10% |
Validator 1 has 30%, which is just short of the 33.34% threshold. Together, validators 1 and 2 control 55% of the stake, which means the Nakamoto Coefficient for our chain is 2. The takeaway: It’s not very decentralized, as you might imagine.
Nakamoto Coefficient on PoW networks
On a PoW network, the blockchain that has accumulated the most work is the valid one. In other words, if several versions of the same blockchain exist at the same time (which is pretty normal given things like latency, etc.), the one with the most PoW is the live one. It’s not just gravity: The heaviest chain is the one that nodes (miners) have worked the most on, so it’s quite reasonable to roll with it.
But what happens when some are mining with pickaxes and someone brings a sci-fi mining laser? That’s figurative, of course, in actual terms, it all comes down to computational power, or hash power, as it’s known. A person or entity who controls more than 50% of the network’s hash power can mine faster than anyone else. Thus, their version of the chain is very likely to be the default one, no matter what. Should this person or entity wish so, they would be able to censor transactions, reorganize them, and even double-spend tokens.
To calculate the Nakamoto Coefficient for a PoW network, you can do a similar procedure as with PoS — rank miners by their hash power share and cumulatively add them until the sum gets past 50%. The idea, again, is to get the minimum number of entities that collectively control more than 50% of the hash power.
Why the Nakamoto Coefficient matters
In general, a network with a high Nakamoto Coefficient is more secure and censorship-resistant. When interacting with this network, you face lower odds of seeing your tokens evaporate in a fraction of a second. Similarly, there’s a slimmer chance of other malicious behavior, like your transactions being arbitrarily rejected.
A low NC, for its part, means that the network could be easier to compromise. As an example of how wrong things can go, consider the infamous hack of the Ronin Network, the sidechain for Axie Infinity — a popular play-to-earn game.
At the time, Ronin only had nine validator nodes. By hijacking five of them, hackers were able to drain the network for about $600 million. That’s a colossal sum, and a glaringly obvious reason why decentralization is a must. It’s not just about the possibility of a malicious node, but also about the prospect of a hacker incident.
On a low-NC chain, a hacker only has to compromise a few nodes, which can still be challenging, but worth the payoff. On a high Nakamoto Coefficient chain, the hacker would have to compromise a vast number of nodes — an operation that may either be impossible or may take so much money, time, and effort that the payoff isn’t there.
Limitations of the Nakamoto Coefficient
For all its usefulness, the Nakamoto coefficient is not a silver bullet. Here are a few things to consider when looking into this metric:
It only accounts for the on-chain data. On-chain, two miners or validators are perfectly separate entities. In reality, they may be controlled by the same person or entity, or otherwise collude off-chain. DYOR and check for public information about node hosts when diving deep.
It is not a static metric. Miners come and go, and stake shares fluctuate all the time as well. So to really be sure, you have to check in on the network every now and then and recalculate the coefficient based on the changes in the node composition.
It only measures one aspect of decentralization. There’s more to consider there, such as governance, for example: is the community involved in major decisions about the network, or is it more centralized? The Nakamoto Coefficient doesn’t include such variables.
Chainspect does, though. On our dashboard, you will find the governance information for 50+ blockchains, as well as their real-time TPS, max theoretical TPS, and various other performance metrics. Dive in now to get a better sense of how decentralized Web3 actually is — and get up to speed on who’s really walking the walk.